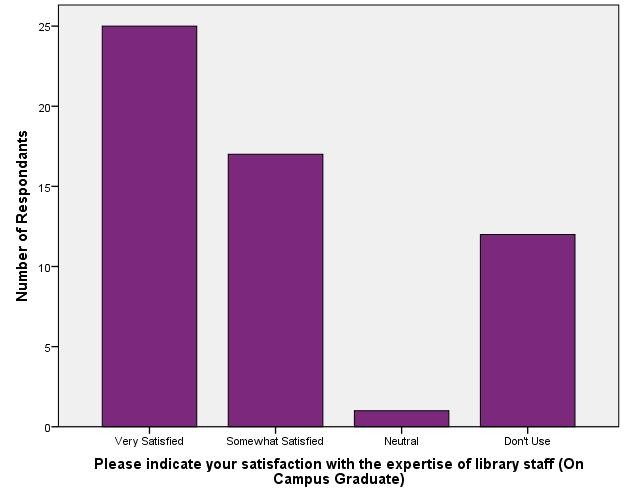
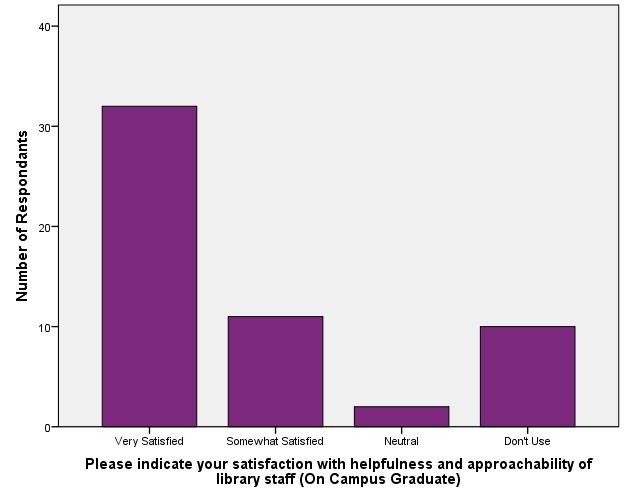
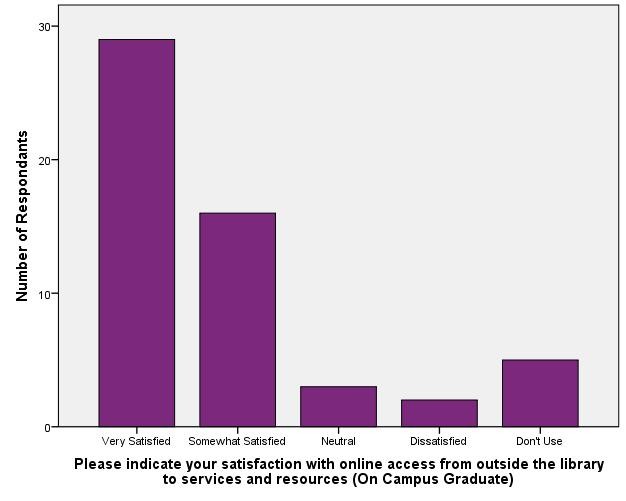
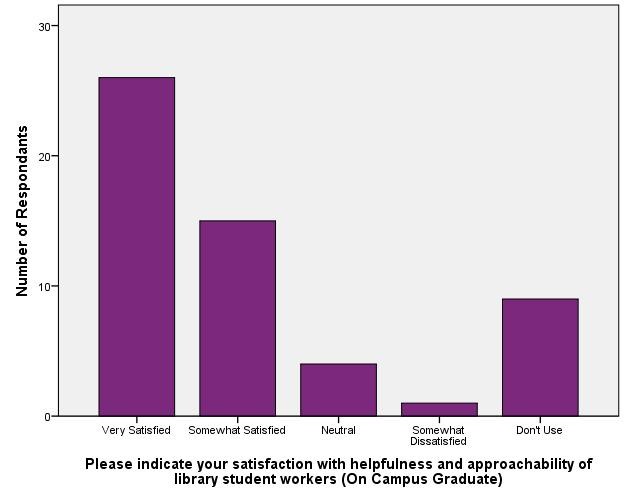
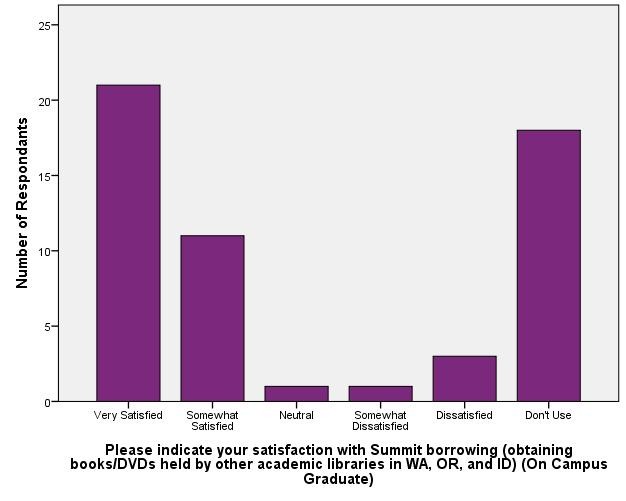
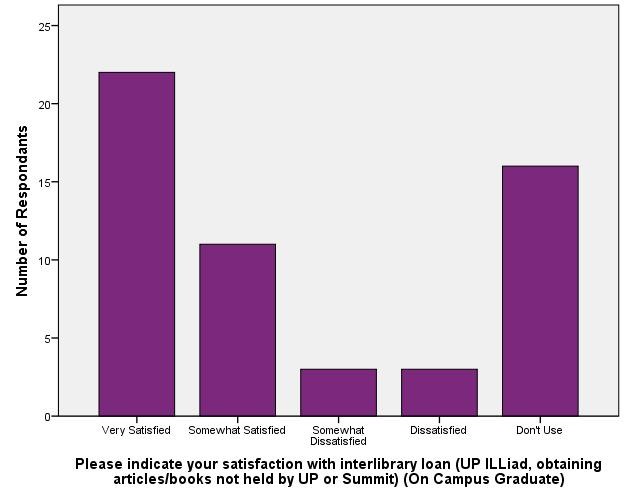
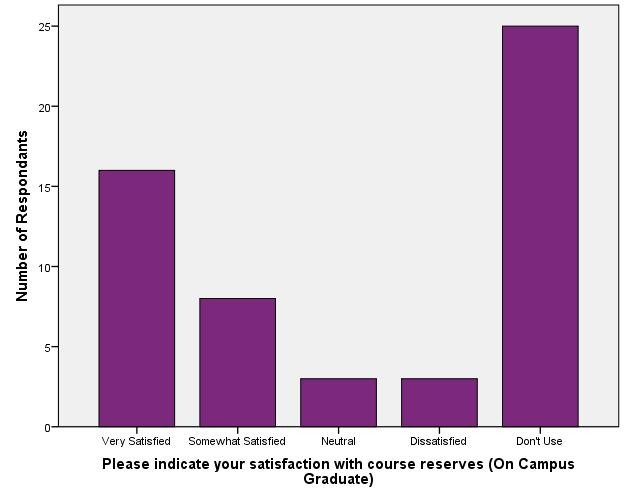
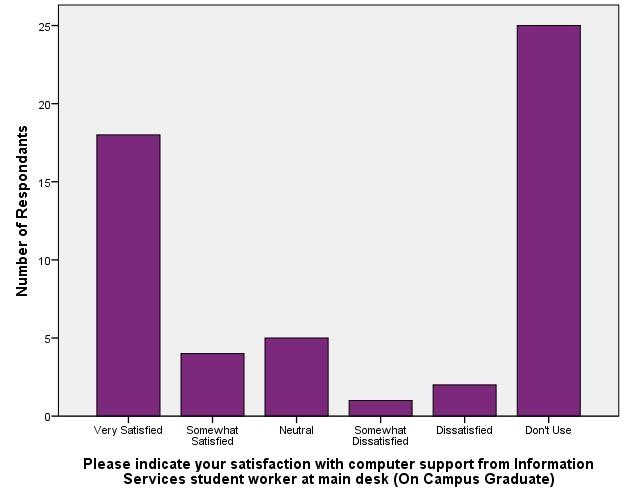
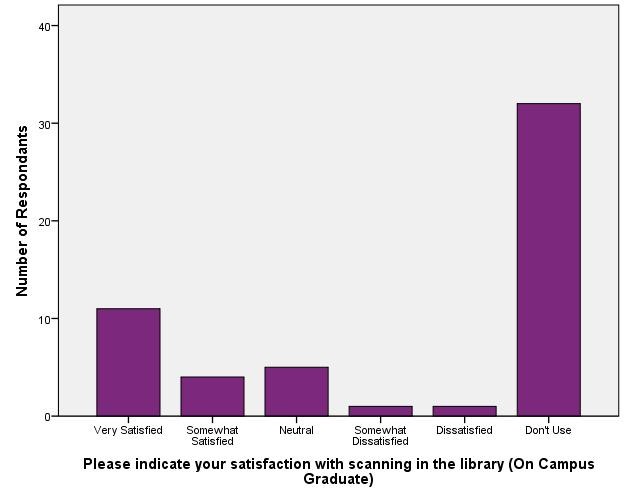
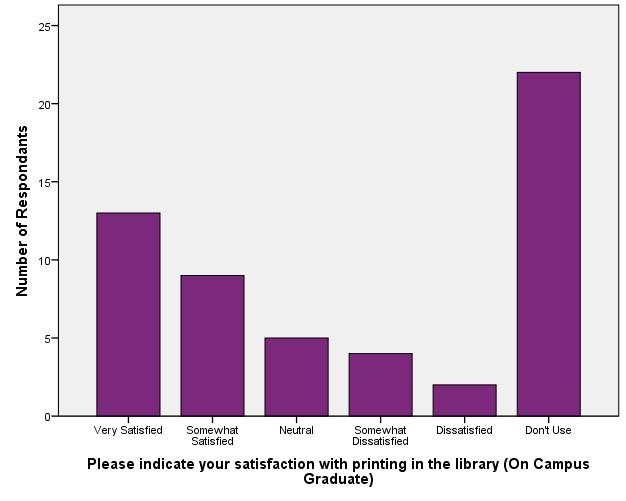
Results show overall satisfaction with library staff and services. Compare with results from a similar question on the 2011 survey. Generally, satisfaction increased for services common to both surveys, except for printing.
The percentages presented below exclude respondents who had not yet used or were not aware of those services; the bar charts present the full range of responses.
Compare responses to this question:
Faculty | Staff | Off-Campus Graduates | Undergraduates
[su_table]
[/su_table]
