IR Data Snapshot (October 2017): Student Voting Rates in Federal Elections
As part of ongoing efforts to empower the UP campus community with information that facilitates everyone’s work towards fulfilling the university’s mission, the Office of Institutional Research would like to share important data snapshots periodically throughout the school year.
Q: What is the research measuring?
A: UP student voting rates in federal elections compared to a national sample of college students.
The National Study of Learning, Voting, and Engagement (NSLVE) investigates college students’ voting trends in federal elections. The work was conducted by the Tufts University’s Institute for Democracy and Higher Education (IDHE) (https://idhe.tufts.edu/nslve) (Twitter @TuftsIDHE). Since 2013, they merged data from over 1000 participating colleges and universities leveraging existing databases such as the National Student Clearinghouse (http://www.studentclearinghouse.org/). Their mission is to shift college and university priorities and culture to advance political learning, agency, and equity
Q: What were the research results?
A: UP students voted in the 2012 and 2016 federal elections at higher rates than the national average for college students.
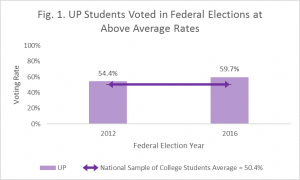
UP highlights of the results show that UP undergraduate students voted in federal elections at rates higher than the average voting rate in the research sample (Fig. 1). UP students who were eligible to vote were also registered to vote at above average rates compared to the national research sample. Data on midterm elections in 2014 show that UP students had a voting rate of 27.9%, a much higher rate than the 19.1% average for the national research sample.

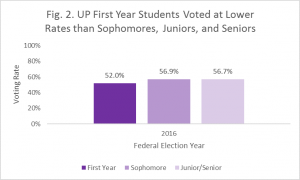
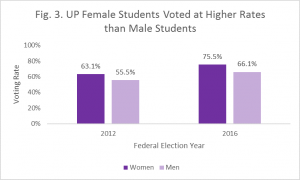
Examining specific populations showed that UP first year students voted at lower rates compared to sophomores, juniors and seniors (Fig. 2). In line with national trends, UP female students voted at higher rates than male students (Fig. 3). In the national sample of college students, the difference of voting rates were nearly seven percentage points in both elections. However, at UP the difference was wider: women voted nearly eight percentage points higher than men in 2012 and then nine percentage points higher in 2016.


Other national trends from the research showed that turnout increases were large for Hispanic and Asian students. Black student turnout decreased from 2012 to 2016, however from a high baseline since they had the highest turnout among racial groups in 2012. News coverage on racial and gender demographics among college student voters includes this npr.org article: “2016 Voter Turnout Dropped at HBCUs, Climbed at Women’s Colleges, Study Finds” http://www.npr.org/2017/09/20/552173339/2016-voter-turnout-dropped-at-hbcus-climbed-at-women-s-colleges-study-finds
Lastly, in line with national trends UP students in the social sciences and health professions voted at higher rates compared to students majoring in other fields.
Q: What can I do with this information?
A: Other schools have used this research as an indicator of their students’ civic engagement and to spur voting initiatives.
News coverage of initiatives at other colleges to foster a habit of voting and civic engagement include this Washington Monthly article: “Young People Don’t Vote. Can Colleges Change That?” http://washingtonmonthly.com/magazine/septemberoctober-2017/young-people-dont-vote-can-colleges-change-that/
The NSLVE research team offer resources on various political topics for use by students and educators available here. https://idhe.tufts.edu/resources
References: Institute for Democracy & Higher Education: National Study of Learning, Voting and Engagement. (2016). 2012 & 2016 NSLVE Campus Report. Medford, MA.